<< Back
The Death Watch: What the Numbers Say About a Possible Shift in the COVID Pandemic

February 17, 2022
Data doesn’t lie, but it can take time to reveal the truth about the past. In the COVID era, it’s tests, cases, hospitalizations and deaths that spike one after the other. Deaths, now at more than 900,000 Americans since the pandemic began, is the final, excruciating, lagging indicator.
But optimism that the pandemic is about to enter a new, less ominous phase has been powered by a drop in COVD-related deaths, both in Connecticut and nationally.
“We are going to continue to see additional deaths this year,” says Dr. Ulysses Wu, Hartford HealthCare’s System Director of Infection Disease and Chief Epidemiologist. “Our job is to reiterate that this is a preventable disease to a certain extent. We want to keep that number low.”
The Centers for Disease Control is now considering ending its indoor mask recommendation, says Director Rochelle Walensky, with declining cases, hospitalizations and deaths.
In the graphics below, you can see the trajectory of deaths in the state and nationally since the pandemic began. The state-by-state death rates — Connecticut has the 12th-lowest — in the past seven days provide a more immediate snapshot of COVID-19 in America.
COVID-Related Deaths in Connecticut
The state has reported 10,324 COVID-related deaths since the pandemic began.
This chart, provided by the state Department of Public Health, shows the number of COVID-19-associated deaths among Connecticut residents by date of death. This includes people who tested positive for COVID-19 around the time of death (confirmed), and those who were not tested for COVID-19 whose death certificates list COVID-19 or SARS-CoV-2 infection as a cause of death or a significant condition contributing to death (probable).
Hover over any a spot in any month for the number of deaths each day.
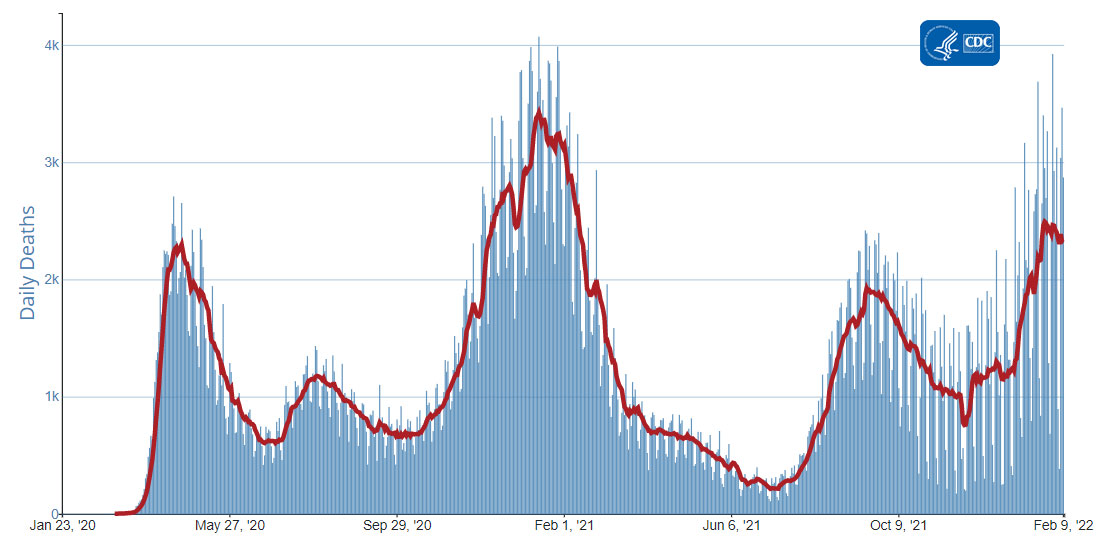
Daily Trends in Number of COVID-Related Deaths in the United States Reported to CDC
The current seven-day moving average of new deaths (2,313) decreased 5.9 percent compared with the previous seven-day moving average (2,459), according to CDC data. As of Feb. 9, a total of 910,373 COVID-19 deaths were reported in the United States. Reported deaths, even in decline, remain substantially higher than pre-Omicron numbers.
7-Day moving average
COVID-Related Death Rates by State
States are ranked by deaths per 100,000 over the past seven days as of Feb. 17.
- Mississippi: 1.52.
Daily average deaths: 45.3
- West Virginia: 1.32.
Daily average deaths: 23.6
- Arkansas: 1.24.
Daily average deaths: 37.6.
- Oklahoma: 1.23.
Daily average deaths: 48.9.
- Idaho: 1.10.
Daily average deaths: 19.7
- South Carolina: 1.08.
Daily average deaths: 55.6.
- Virginia: 0.96.
Daily average deaths: 81.9.
- Florida: 0.96.
Daily average deaths: 206.6..
- Ohio: 0.95.
Daily average deaths: 111.4.
- New Mexico: 0.90.
Daily average deaths: 18.9.
- Alabama: 0.87.
Daily average deaths: 42.4
- Tennessee: 0.87.
Daily average deaths: 59.6.
- Indiana: 0.87.
Daily average deaths: 58.3.
- Kentucky: 0.85.
Daily average deaths: 38.1.
- South Dakota: 0.84.
Daily average deaths: 7.4.
- Michigan: 0.83.
Daily average deaths: 83.3.
- Missouri: 0.83.
Daily average deaths: 51.1.
- Delaware: 0.82.
Daily average deaths: 8.0.
- Nevada: 0.82.
Daily average deaths: 25.1.
- Kansas: 0.81.
Daily average deaths: 23.6.
- Georgia: 0.79.
Daily average deaths: 84.1.
- Texas: 0.74.
Daily average deaths: 215.9.
- Louisiana: 0.73.
Daily average deaths: 34.0.
- Massachusetts: 0.72.
Daily average deaths: 49.4.
- Pennsylvania: 0.71.
Daily average deaths: 90.9.
- Illinois: 0.67.
Daily average deaths: 85.0.
- North Carolina: 0.66.
Daily average deaths: 69.1.
- Arizona: 0.65.
Daily average deaths: 47.6.
- Washington: 0.59.
Daily average deaths: 44.7.
- New Jersey: 0.57.
Daily average deaths: 51.0.
- Montana: 0.55.
Daily average deaths: 5.9.
- Wyoming: 0.54.
Daily average deaths: 3.1.
- Iowa: 0.54.
Daily average deaths: 17.0.
- Wisconsin: 0.50.
Daily average deaths: 29.3.
- California: 0.49.
Daily average deaths: 194.0.
- Minnesota: 0.48.
Daily average deaths: 27.3.
- North Dakota: 0.47.
Daily average deaths: 3.6.
- Alaska: 0.47.
Daily average deaths: 3.5.
- Connecticut: 0.45.
Daily average deaths: 16.2
- Utah
Deaths per 100,000: 0.44
Daily average deaths: 14.1.
- Nebraska: 0.44.
Daily average deaths: 8.5.
- New Hampshire: 0.44.
Daily average deaths: 6.0.
- New York: 0.44.
Daily average deaths: 85.6.
- Hawaii: 0.41.
Daily average deaths: 5.9.
- Maine: 0.41.
Daily average deaths: 5.6.
- Vermont: 0.39
Daily average deaths: 2.4
- Colorado: 0.37.
Daily average deaths: 21.
- Rhode Island: 0.34.
Daily average deaths: 3.6.
- Maryland: 0.33.
Daily average deaths: 19.7.
- Oregon: 0.32.
Daily average deaths: 13.4.